Excel 1 - SV - SV settings
The Everyday Excel UserTest in Swedish with Excel in Swedish settings. Ideal for candidates with limited data-intensive tasks or complex models. Assesses general proficiency in everyday use.
Date
09 May 2025
Candidate: |
Henrik Dennerheim |
Competence: |
Competent - level: 3 of 4 |
Time spent: |
12:01 of 40:00 |
Issuer: |
Demo Kunskapstest, EPROVED |
Test | Competence | Points | Answered | Status | Date |
---|---|---|---|---|---|
Business Controller - SV |
3/4 |
62% |
22/24 |
Complete |
2025-05-09 14:57:17 |
Business Control |
2/4 |
35% |
12/24 |
Complete |
2023-03-10 10:38:12 |
The candidate demonstrates strong skills in business control and management.
Beginner
0% - 24%
Basic Proficiency
25% - 49%
Competent
50% - 76%
Skilled
77% - 100%
The candidate demonstrates extensive and in-depth knowledge in business performance monitoring and, in addition to interpreting charts and tables, can provide detailed explanations of variances, such as deviations from the budget or forecast. They are skilled in analysing the reasons for deviations in results, assessing underlying revenue, and deriving revenue insights through margin and growth, among other factors.
The candidate has basic knowledge of financial management and understands commonly used performance metrics, ratios, and Key Performance Indicators (KPIs). They are also familiar with concepts such as budget and forecast.
The candidate demonstrates strong knowledge in investment analysis and is proficient in product and investment calculations at an advanced level. They are capable of performing sensitivity analysis, assessing the impact of price increases on sales volume and profitability, and determining necessary price levels based on the distribution of profits in the value chain, among other skills.
The candidate demonstrates exceptional efficiency in the software, showcasing advanced proficiency in utilising functions for managing large datasets (e.g., VLOOKUP, HLOOKUP, INDEX, MATCH, DGET). Additionally, they exhibit strong competence in applying logical functions to address both single and multiple criteria (e.g., IF, AND, SUMIF, SUMIFS, COUNTIF, COUNTIFS, etc.).
Points
Time
Points
Time
Henrik Dennerheim's score was 31% above the average of all other test-takers.
Henrik Dennerheim's score was 31% above the average for the benchmark group (Business Control - Specialist, 4-6 yrs).
Henrik Dennerheim's score was 78% above the average for the benchmark group (Business Control - Specialist, 4-6 yrs).
Henrik Dennerheim's score was 45% below the average for the benchmark group (Business Control - Specialist, 4-6 yrs).
Henrik Dennerheim's score was 23% above the average for the benchmark group (Business Control - Specialist, 4-6 yrs).
Henrik Dennerheim's score was 59% above the average for the benchmark group (Business Control - Specialist, 4-6 yrs).
Question | Question area | Question type | Time | Status | Level |
---|---|---|---|---|---|
5 | Business Monitoring |
Analysis of underlying revenue, assess key performance indicators in the business
1 of 1 correct answers and 0 wrong and got 3 out of 3 points |
00:21 | Difficult | |
6 | Financial Management |
Margins in the value chain, identify product(s) for price increase through analysis of product mix and sales
0 of 1 correct answers and 0 wrong and got 0 out of 3 points |
00:18 | Difficult | |
8 | Investment Analysis |
Sensitivity analysis, assess the impact of a price increase on sales volume and profitability
1 of 3 correct answers and 0 wrong and got 1 out of 3 points |
00:22 | Difficult | |
9 | Investment Analysis |
Charts, assess the rolling 12-month revenue trends of different product categories and internal allocation
1 of 2 correct answers and 1 wrong and got 0 out of 3 points |
00:32 | Difficult | |
10 | Business Monitoring |
Actual vs. budget and prior year, reasonable explanations for deteriorated operating income
1 of 2 correct answers and 0 wrong and got 1,5 out of 3 points |
01:20 | Difficult | |
12 | Functions in Excel |
IF, AND
1 of 2 correct answers and 0 wrong and got 1,5 out of 3 points |
00:53 | Difficult | |
14 | Functions in Excel |
SUMIFS / Summation with multiple criteria
1 of 1 correct answers and 0 wrong and got 3 out of 3 points |
00:22 | Difficult | |
15 | Financial Management |
Credit terms, calculate the average credit period to customers (via the Income Statement and Balance Sheet)
0 of 1 correct answers and 0 wrong and got 0 out of 3 points |
00:31 | Difficult | |
1 | Functions in Excel |
COUNT
0 of 1 correct answers and 1 wrong and got 0 out of 1 points |
00:30 | Easy | |
2 | Business Monitoring |
Charts, interpretation of a progressive curve
1 of 1 correct answers and 0 wrong and got 1 out of 1 points |
00:13 | Easy | |
16 | Financial Management |
Various performance metrics, calculate the size of depreciation based on a Financial Statement (Residual Value)
0 of 1 correct answers and 1 wrong and got 0 out of 1 points |
00:11 | Easy | |
19 | Functions in Excel |
HLOOKUP
1 of 1 correct answers and 0 wrong and got 1 out of 1 points |
00:18 | Easy | |
20 | Business Monitoring |
Revenue growth, assessing the company with the highest growth between two years
1 of 1 correct answers and 0 wrong and got 1 out of 1 points |
00:46 | Easy | |
21 | Financial Management |
Ratios, calculate solvency
1 of 1 correct answers and 0 wrong and got 1 out of 1 points |
00:06 | Easy | |
23 | Investment Analysis |
Investment calculations, key parameters
1 of 1 correct answers and 0 wrong and got 1 out of 1 points |
00:13 | Easy | |
24 | Investment Analysis |
Investment calculations, understanding of break-even
1 of 1 correct answers and 0 wrong and got 1 out of 1 points |
00:17 | Easy | |
3 | Functions in Excel |
IF
2 of 2 correct answers and 0 wrong and got 2 out of 2 points |
00:40 | Intermediate | |
4 | Financial Management |
Selecting situations when data should be presented on a rolling 12-month basis, considering seasonal variations
0 of 1 correct answers and 1 wrong and got 0 out of 2 points |
00:13 | Intermediate | |
7 | Business Monitoring |
Table, explanation for why certain months have positive costs related to the change in vacation pay liability
1 of 1 correct answers and 0 wrong and got 2 out of 2 points |
00:22 | Intermediate | |
11 | Financial Management |
Forecast, meaning & purpose
1 of 1 correct answers and 0 wrong and got 2 out of 2 points |
00:19 | Intermediate | |
13 | Investment Analysis |
Investment calculations, assessing the year for break-even (when the investment becomes profitable)
1 of 1 correct answers and 0 wrong and got 2 out of 2 points |
00:34 | Intermediate | |
17 | Business Monitoring |
Deriving goods purchases through Income Statement & Balance Sheet (using opening and closing inventory as well as cost of goods sold)
1 of 1 correct answers and 0 wrong and got 2 out of 2 points |
01:03 | Intermediate | |
18 | Investment Analysis |
Investment calculations, computing results and break-even (with variable and fixed costs)
2 of 2 correct answers and 0 wrong and got 2 out of 2 points |
00:47 | Intermediate | |
22 | Functions in Excel |
SUMIF / Summation with one criterion
1 of 1 correct answers and 0 wrong and got 2 out of 2 points |
00:34 | Intermediate |
Correct answer
Weighted point, partly right on the question
Wrong answer
Either skipped or out of time
TEST AREAS
"REPORTING VS. BUSINESS-ORIENTED PROFILES"
Test in Swedish that differentiates candidates handling basic follow-up tasks from those with strategic, business-oriented profiles experienced in working with and analysing large datasets.
Business Monitoring
The candidate's knowledge, ranging from basic aspects such as interpreting and understanding charts, assessing profitability, the meaning of correlation, variance against budget, forecast, and prior year, explaining deviations, evaluating key performance indicators in the business etc, to more advanced areas – for example analysis of underlying revenue, deriving revenue through margin and growth, deriving purchases, calculating the number of employees in an equilibrium state, etc.
Financial Management
Skills in various performance metrics in the business, Key Performance Indicators (KPIs), commonly accepted ratios, budget, forecast, operational risk, capital allocation, credit terms, etc.
Investment Analysis
The candidate's proficiency in investment calculations – including understanding of key parameters, Present Value, and break-even analysis – as well as the ability to evaluate various investment options from a profitability perspective, product costing, contribution margin, price adjustments with sensitivity analysis, and identifying profits in the value chain, among other aspects.
Functions in Excel
Usage of various data functions such as SUM, COUNT, AVERAGE, VLOOKUP, HLOOKUP, DGET, INDEX, MATCH, and various logical functions – for example, IF, AND, OR, summation with one criterion through SUMIF, COUNTIF, and summation with multiple criteria through SUMIFS, COUNTIFS, etc.
TEST QUESTIONS
Multiple Choice
Our tests are mainly based on multiple-choice questions where the number of correct answer options varies. Each question has four answer options.
Questions by Area and Difficulty
The tests are divided into four question areas and questions are categorised into three difficulty levels: easy, intermediate and difficult.
Randomised Test Generation
Questions within each area and difficulty level are randomly selected from a question bank, ensuring that each test receives a unique set of questions. Additionally, the order of answer options is randomised so that the correct answer for each question never appears in the same position.
24 Questions and Multimedia Options
A total of 24 questions are generated and must be answered within 40 minutes. During the test, candidates can skip questions and come back to them later. They also have access to a timer and a progress indicator. The test will automatically close when the maximum time limit is reached.
Test questions and answer options can consist of text, images, or a combination of text and images.
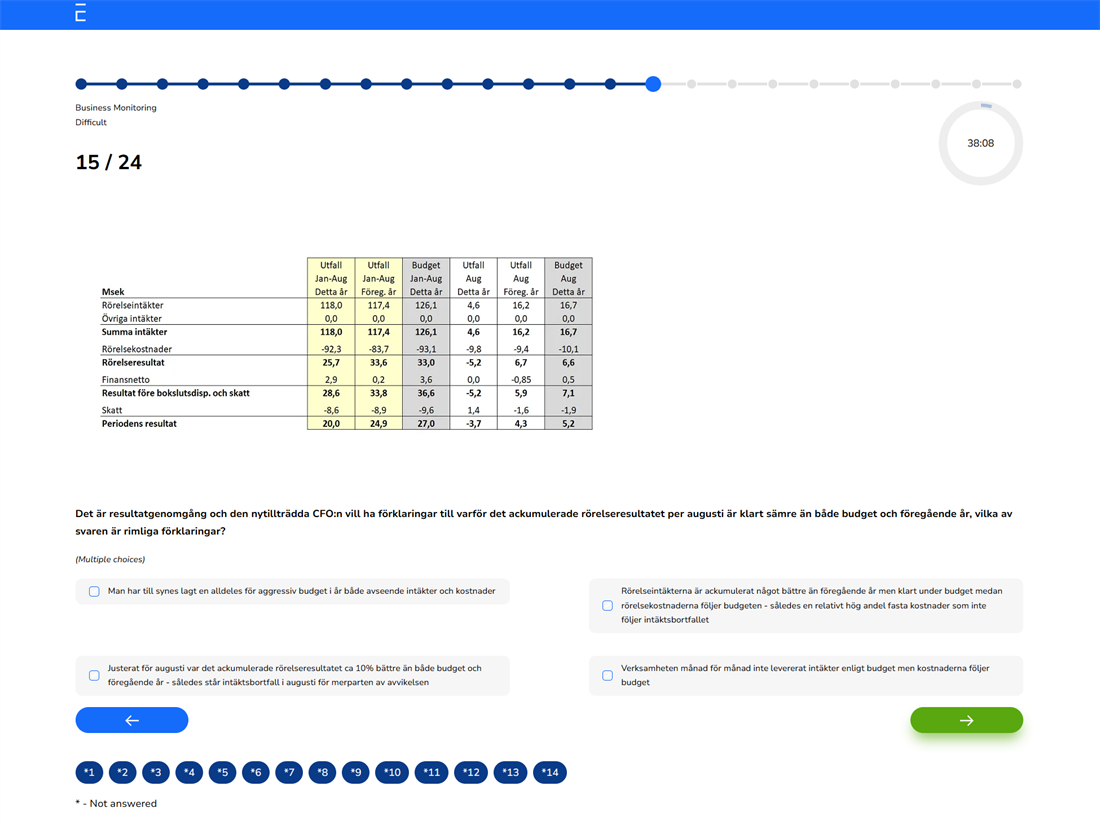
Example Question